Assume a simple 4 column dataset as shown below. This data shows which ID had which type of subscription in which year. So ID A, which started as a "Free" subscriber in 2018 switched to a "Premium" subscriber in 2019 and then churned out in 2020. Likewise, ID D which started as a "Pro" subscriber in 2018, churned out in 2019 but returned as a "Free" subscriber in 2020.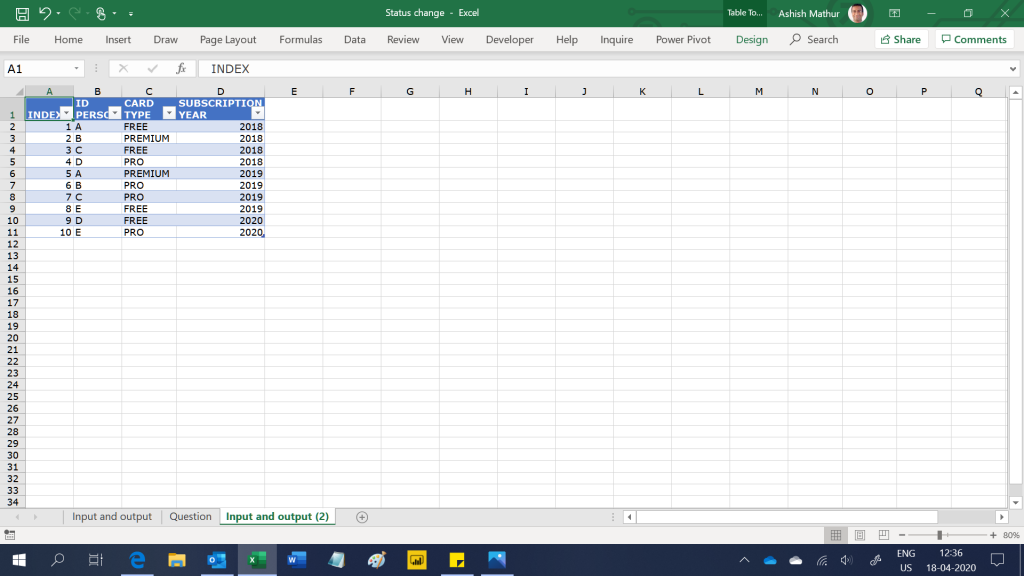
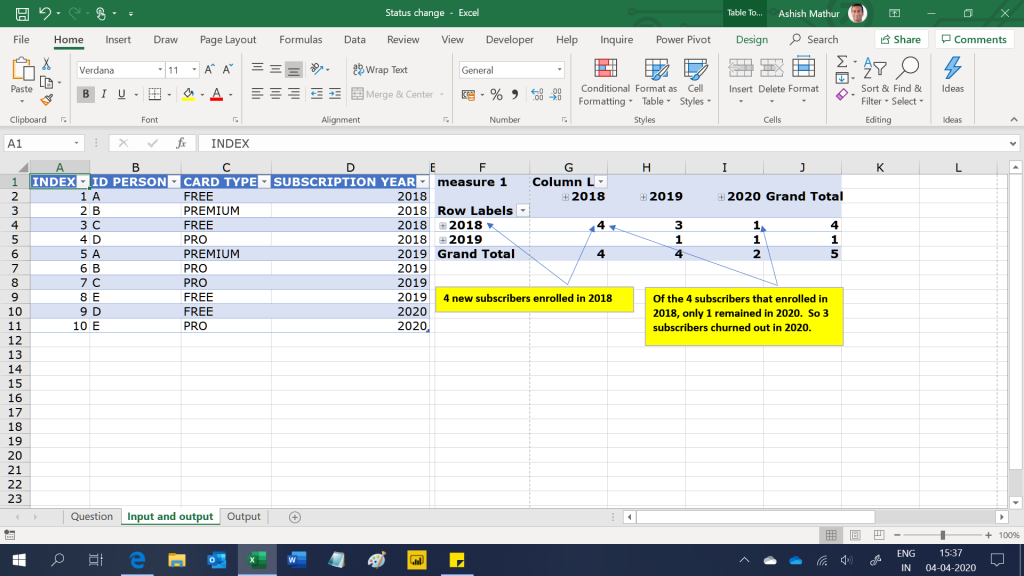
The objective is to study how subscribers switched from one subscription type to another across year. So the expected result should look like this
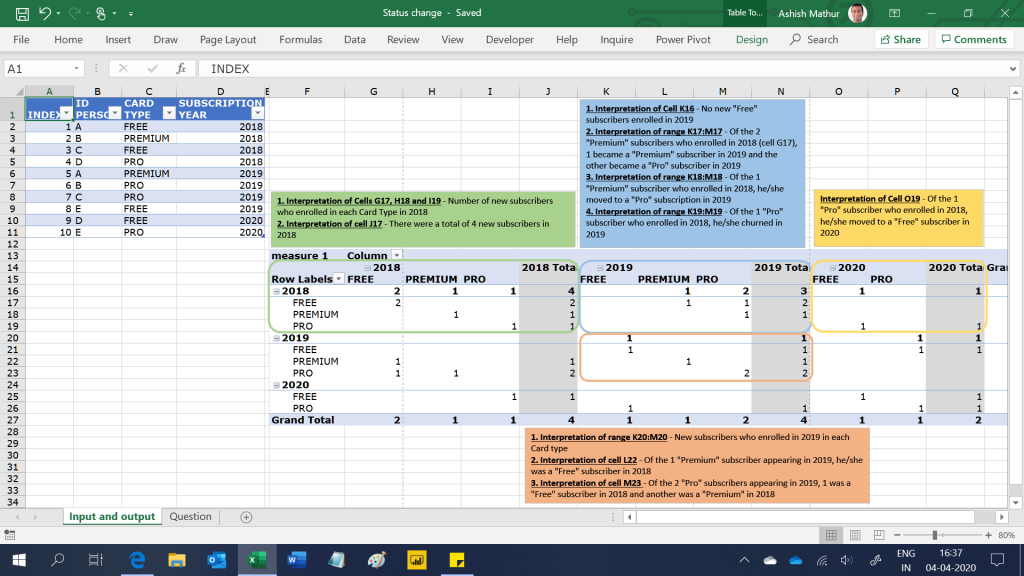
I have solved this question using the PowerPivot. You may download my MS Excel workbook from here.