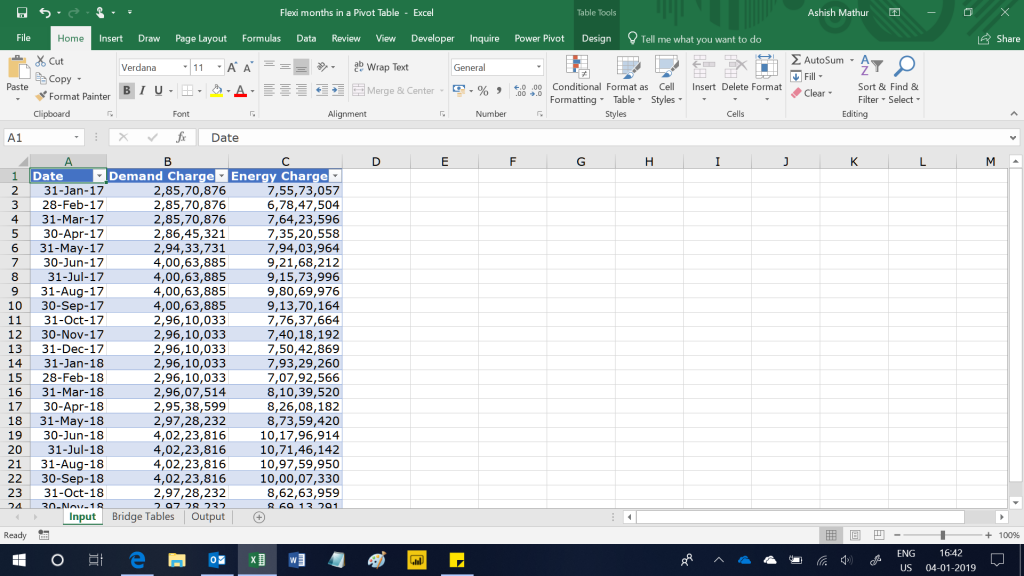
In this simple 3 column dataset shown below, one can see the month wise demand and energy charge for 2 years - 2017 and 2018.
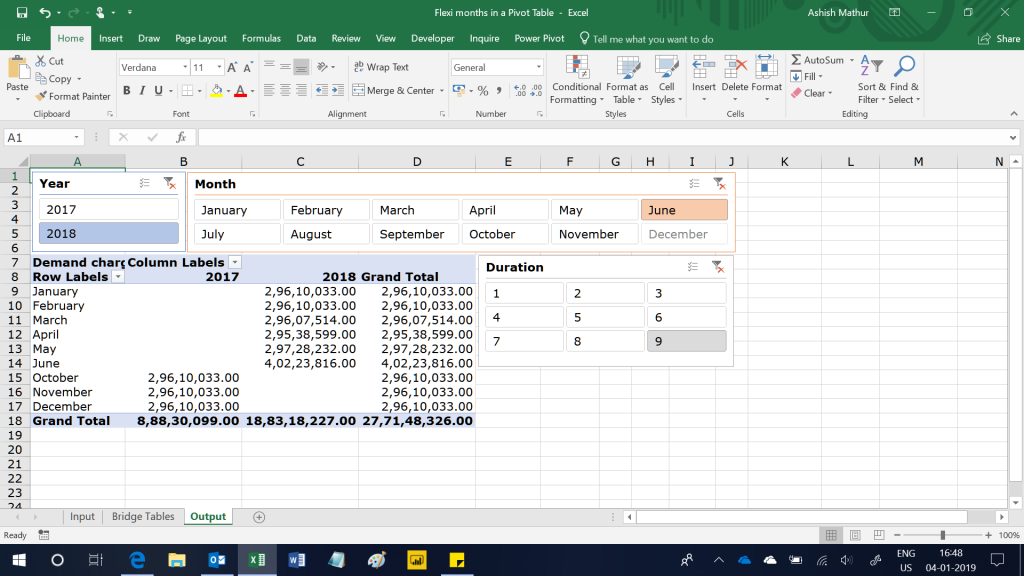
The objective is to compute the month wise demand charge for x months ended a certain user defined Year and Month. So, if a user selects the Year as 2018, Month as June and Duration as 9, then the Pivot Table should show month wise demand charge for the 9 months ended June 2018 i.e. from October 2017 to June 2018. Likewise, if a user selects Year as 2018, Month as May and Duration as 3, then the Pivot Table show should month wise demand charge for the 3 months ended May 2018 i.e. March 2018 to May 2018.
You may download my solution workbook from here.